
A half a percent may not seem like much in the abstract, but considering the massive scale of digital advertising impressions viewed by consumers, it adds up quick. In its just-released Ad Quality Report for second quarter 2018, cyber security specialist Confiant finds that 0.5% of ads served through open programmatic marketplaces are contaminated with malicious code.
Think about it this way—1 out of every 200 ad impressions from the open exchanges is malvertising. If 1 trillion ads are being served through the open marketplace monthly, Confiant estimates that 5 billion are malicious.
In 2017, marketing strategist Mehmood Hanif estimated that the average Internet user is served 11,250 ads per month—not all of those come through open programmatic marketplaces, but if Confiant’s reporting is to be trusted, the average user is probably getting hit with malvertising several times a week.
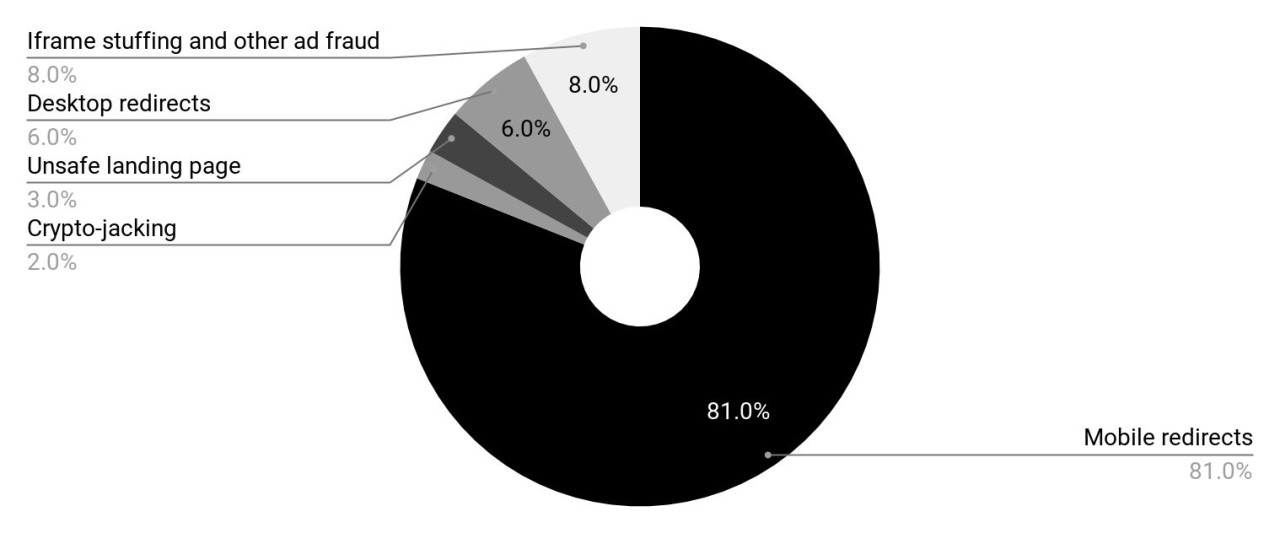
This will come as no surprise to anyone who has closed a redirect window lately—and Confiant’s data show that mobile redirects made up 81% of malvertising in the second quarter. That dwarfed all other types of malicious behavior, including iframe stuffing (8%), desktop redirects (6%), unsafe landing pages (3%), and the newer bad boy on the block, cryptojacking (2%).
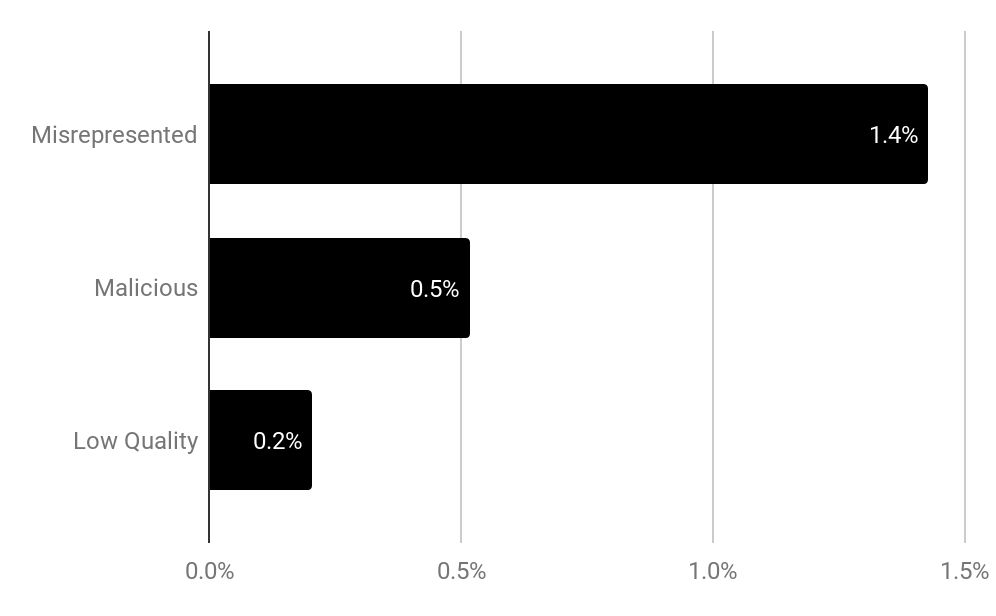
Between April and June 2018, Confiant monitored more than 60 billion programmatically served ads across 2,200 sites, and 1.5 trillion ad requests across multiple exchanges. Malvertising isn’t the only crud passing through the open programmatic works—1.4% of inventory coming through the exchanges is misrepresented, with the most common example being display slots passed off as pre-roll.
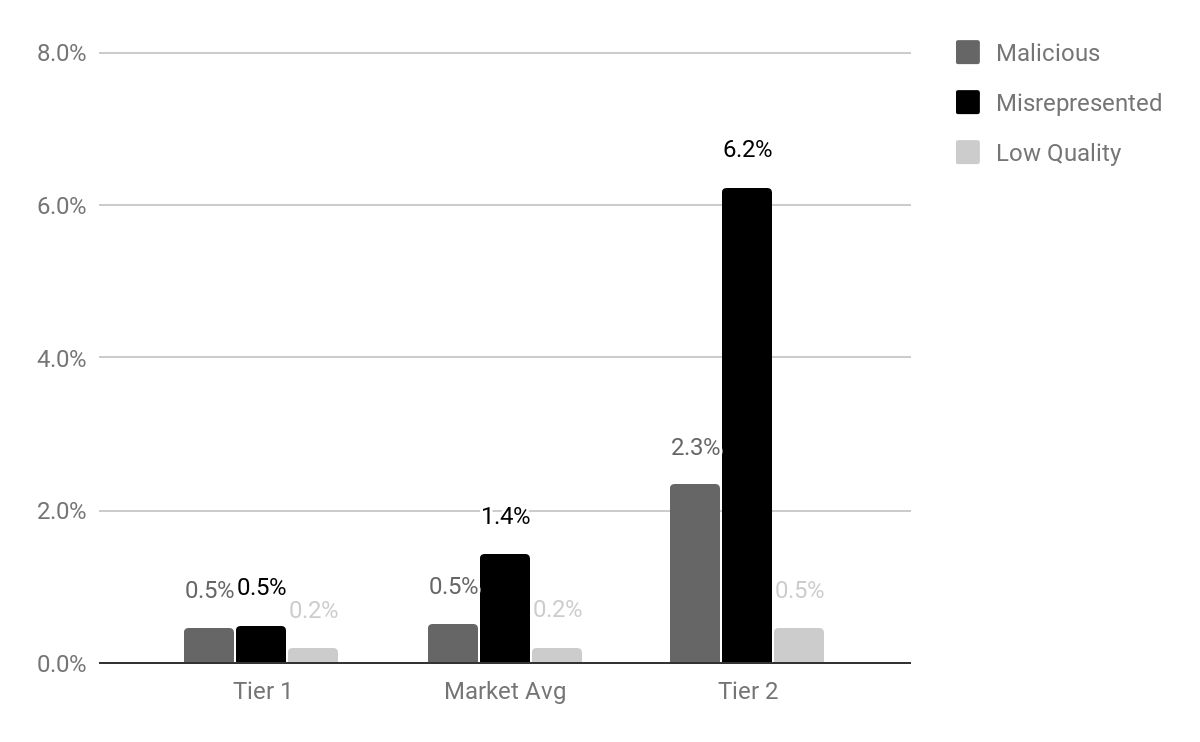
Where oh where do these horrid ads come from? It couldn’t be from your trusted exchange, could it? Breaking the 12 top exchanges into two tiers, 2.3% of the ads passing through the four exchanges in the bottom tier contained malicious code.
But the eight markets in the top tier exhibited a 0.5% malvertising rate, the exact same as the average for all the exchanges. The big differentiator between the tiers was misrepresented impressions—0.5% of ads flowing through tier 1 exchanges were misrepresented compared to 6.2% of the inventory in tier 2 exchanges.
Noting that most traffic quality reports are written for media buyers, Confiant assembled its ad-traffic quality report to highlight the perils of ad fraud for publishers. Advertisers getting scammed via bot networks and bogus publishers take up the lion’s share of the ad fraud conversation, though publishers are also suffering from bad ad activity that can be detrimental to user experience.
“We would like to equip publishers with information that could help them plan better, know what to expect from their demand partners and also possibly improve the status quo, pushing back on misrepresented inventory (e.g., IBV) and other issues,” says Confiant CEO and Cofounder LD Mangin.
The report also analyzes the composition of malicious, misrepresented, and poor-quality creative coming from the top 5 DSPs, finding a negative correlation between malicious code and misrepresented ads. In addition, Confiant also finds that misrepresented in-banner video doesn’t always fetch a high CPM, with 54% of those studied coming in below market average. Fifty-seven percent of ads with malicious code exhibited CPMs below market average.
There’s even more fascinating data on bad ads in the full report, but be warned, publishers—you might need a stiff drink while you pore through.