The press has lately been wall to wall with revelations about the emergent ‘data economy.’ True, we have the means to collect a wide variety of data from a variety of consumers in every industry, but that alone isn’t enough to spurn a data ‘revolution.’ Numbers alone are just numbers. The power to turn a jumble of numbers into something useful lies in analysis. Only through analytics can our overabundance of data have a meaningful impact on everyday business.
Advertisers, in particular, have to wade through a boatload of acronyms, from CPC to CTR in order to get anything done. One major avenue to simplifying the digital exchange process has come through Real-Time Bidding (RTB). As you probably know, RTB allows advertiser to bid on each impression in real time – as it is served.
But how does RTB actually work? By using data. RTB Platforms like Nexage, Pubmatic, DataXu, and Jumptap aggregate user data to provide information to advertisers about the audience each impression will reach. This data is usually behavioral information taken from tracking cookies, and the more specific this data is, the more valuable it will be to marketers.
I spoke with Nexage’s Victor Milligan this week to get a better understanding of how the company is using its mountain of data to provide better analytics for users. Nexage has recently endeavored to improve visibility at the “atomic” level for their RTB platform. Their new program is designed to work at the level of individual auctions and impressions. This would allow users on both the buy and sell side to better understand their own competitiveness, and should increase overall liquidity in the market.
With auction-level visibility, publishers are able to understand how their impressions are valued (compared to other similar publishers) by buyers. On the other side of the exchange, bidders are informed of the competitiveness of their bids against others in their cohort. This is all done without sharing companies’ names or specific information.
This process begins by simply aggregating data. Nexage collects a mountain of data from the 13 billion impressions it manages each month, but must manage this data effectively. The goal, of course, is not to have as much data as possible, but rather to pull the right data – statistically significant data, which can then be placed into a “cube,” an analytic construct that allows Nexage to look at multiple dimensions of data.
Building the “cube” took some time. Nexage uses a technology that’s quite good at generating these algorithms and statistics, a very heavy-lifting, “atomic” tool. On top of that, Nexages uses another tool to do pattern analysis, do the actual analysis of data, elucidate patterns, and visualize the results.
Nexage is then able to look at each of their 500 million auctions per day from publisher, site, whether there’s first-party data, operating system, country, whether there’s implicit demographic data, whether there are associated benchmark prices (typically things like this go for $X), technical data (what SDK is in place, etc.), and other views. By allowing the company to look at any view easily, the cube gives Nexage a lot of information about what’s driving and what’s diluting value.
For example, Nexage has applied this “atomic”-level analysis to a “location cohort” comprised of publishers that provide location-enabled impressions. Nexage was able to analyze how the price bid distribution changed over time in order to understand how buyers value these impressions over time (see graph). Nexage found increases in value in location overall, and at the specific attribute level (lat/long, zip, DMA, etc.). In fact, Nexage found that lat/long is particularly valuable to buyers, which makes sense, as there has been an increase in demand for hyper-local campaigns. 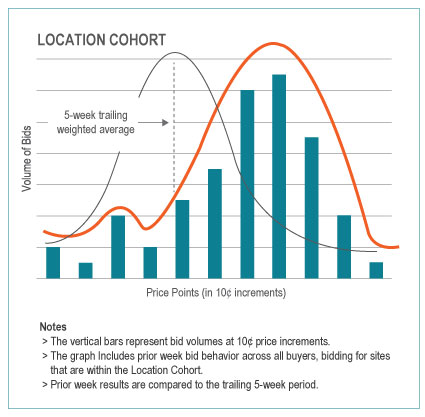
(Image Source: Nexage)
Once Nexage has generated this kind of information, it is sent back to publishers, who are then able to re-evaluate and optimize their own inventory. The decisions publishers make have been shown to affect demand as soon as the next day. The end result is that publishers get a better CPM value and more revenue, while buyers are able to purchase inventory they really want – the liquidity of the exchange, overall, increases.
By creating an analytic environment that allows the company to handle and process its large volume of data, Nexage is able to feed its users facts, trends, and evidence that are helpful and that can be applied immediately. So, as Nexage has shown, though our bevy of advertising numbers may seem like madness, with the right analytics, we might find the method and the usefulness therein.