
We’ve long been big header cheerleaders at AdMonsters, but we also have never shied away from one of its biggest setbacks: potential latency issues. Indeed, fear of latency has kept some premium publishers away from header integrations and continues to make others wary about embracing header tech too closely.
At the same time, maybe we haven’t gone enough into the specifics of how header integrations add to latency—and how to measure the effect. PubMatic’s breakout on header wrappers last week at the Nashville PubForum brought to light that there’s a great deal of confusion around where latency rears its ugly head and how to measure and mitigate it.
PubMatic Architect Abhinav Sinha notes that evaluating latency concerns is not just as simple as monitoring ad call timeouts. In the interview below, he offers some actionable advice for monitoring and minimizing latency—not just when it comes to your header business.
ABHINAV SINHA: Ad calls time out because of network latency, right? Not necessarily.
Publisher wrapper tools (including PubMatic’s OpenWrap) calculate JavaScript-measured latency, which is actually a combination of network latency plus a wide array of other on-page factors that impact all your bidders equally. In fact, you may have partner bids come in with network latency well within wrapper limits, yet still time out. Why? Because all that additional page activity (aka execution overhead) is included in the latency calculation:
JavaScript-measured latency = partner network latency + page execution overhead
Execution overhead is essentially all the other content-related activity, queues and bottlenecks happening on a publisher page concurrent with ad calls and bids. Pages with a lot of content, video widgets, images, CSS and JavaScript running, for example, will have a lot of execution overhead.
 JavaScript executions contribute heavily to this noise. While you might assume that having asynchronous ad calls means all your JavaScript executions happen in parallel, it’s not so. JavaScript is single-threaded, and even your wrapper has to stand in that queue.
Similarly and contrary to popular belief, there’s actually a cap on how many outgoing network calls can happen at one time. The maximum is seventeen parallel connections and even fewer per domain, which decreases further for older browsers and mobile platforms. In other words, SSP partners that make multiple calls are actually making page performance worse and increasing overhead.
All this execution overhead gets layered on top of network latency in the JavaScript measured latency metric you see on your analytics dashboard. That added latency not only causes some otherwise timely bids to overshoot the time-out, it also means publishers must be very careful to compare apples with apples when evaluating partner latency performance.
The good news is that most of that added latency is within publisher control. Execution overhead is a matter of page, content and implementation issues that vary from page to page and publisher to publisher. These issues impact all your bidders equally, but they make comparison a bit tricky.
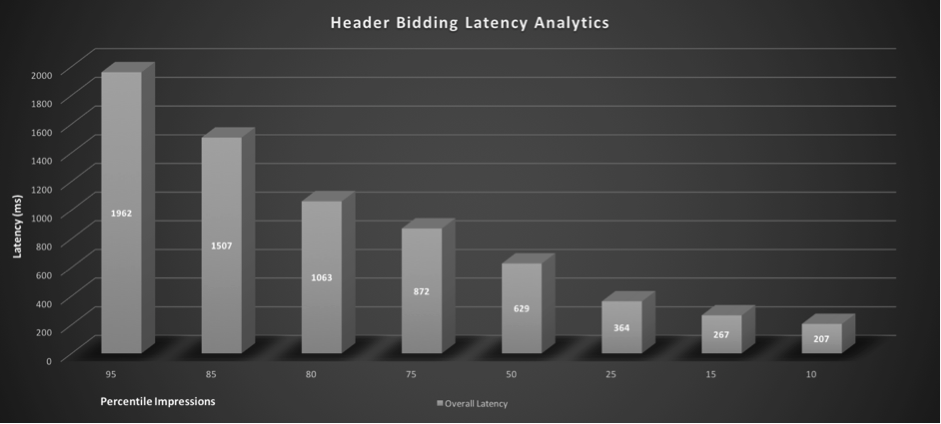
AS: Understanding the components that contribute to JavaScript measured latency and making sure you are consistent in your reporting is step one toward better latency management. For example, a trend from sample data captured from live page analysis shows the latency overhead ranges from 40% to as high as 150% of network time.
Here sample analysis data shows JavaScript-measured latency, where overall latency seems to be very high:
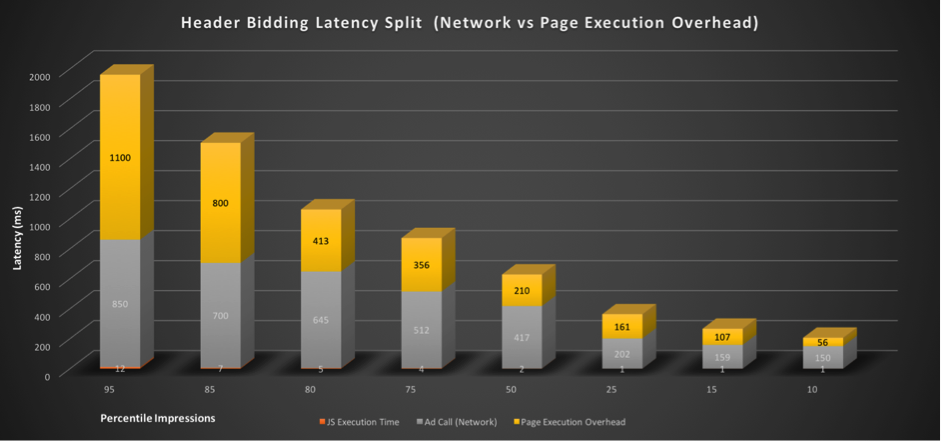
On measuring individual latency components, we observed page execution overhead contributing to majority of the latency:
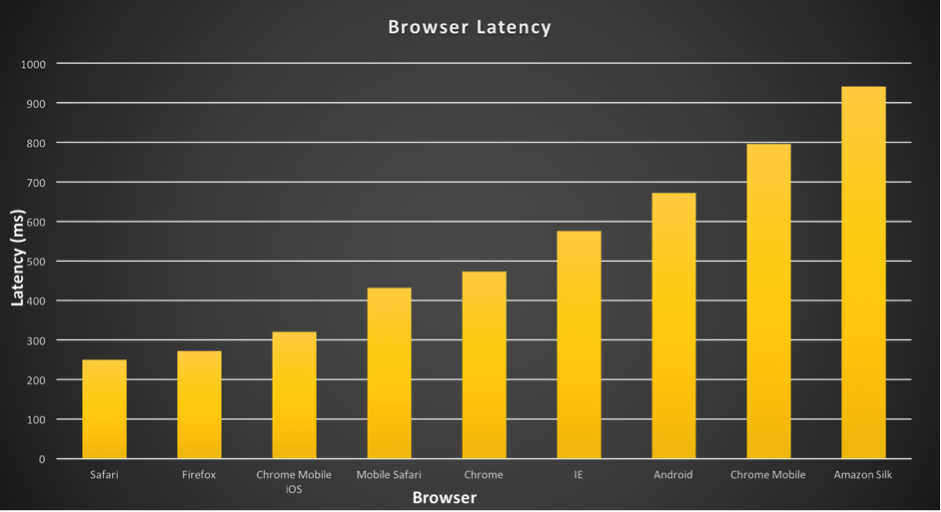
Device/browser level latency data will be key in determining optimization parameters like timeout, partners and eCPM. Looking at the sample data you might look at changing timeout for mobile web inventory vs desktop inventory.
GD: What do you suggest for cleaning up my execution overhead?
AS: Here are a few steps you can take:
- Consider removing synchronous and blocking JavaScript from your site.
- Load inline iframe-based widgets and video players using dynamic and asynchronous iframes.
- Reduce network congestion by delaying content load which is below a viewable area, e.g., content which is loaded only when a person scrolls down.
- You can choose to use standard optimization tools to analyze pages on mobile as well as web platforms.
- Analyze advanced run time performance and execution with developer tools.
- Use optimization techniques, like web workers, to mitigate the impact of high computation tasks on page performance. This allows for web content to run scripts in background threads, making JavaScript single threaded executions perform closer to multithreaded.
- We recommend resource timing API to measure true network latency from within JavaScript in order to get a complete breakout from live/large sample sets.
- Compare apples to apples – with all your header bidder partners, be sure you know what latency data you are looking at: network latency, overhead latency or a combination.