We saw that Google Analytics now supported Page Load Time metrics out-of-the-box and started thinking about how we might be able to use GhostWriter’s insights into third-party content (read: ads) performance to give users of both GhostWriter and Google Analytics highly granular performance measurements.
GhostWriter’s hooks allow you to execute custom call back functions at the beginning and end of each ad call. The hook records the timing of each of these events and submits custom events to Google Analytics using its _trackEvent() method. We’re using this page to test.
Ad Load Time Reports
Check out this eye candy. All Event values are in milliseconds.
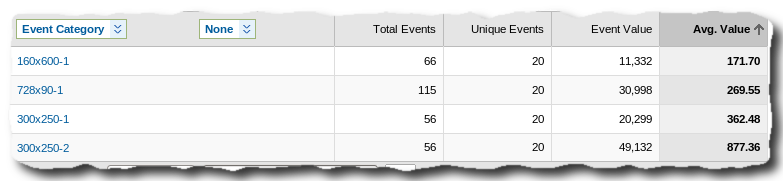
Average loads times:
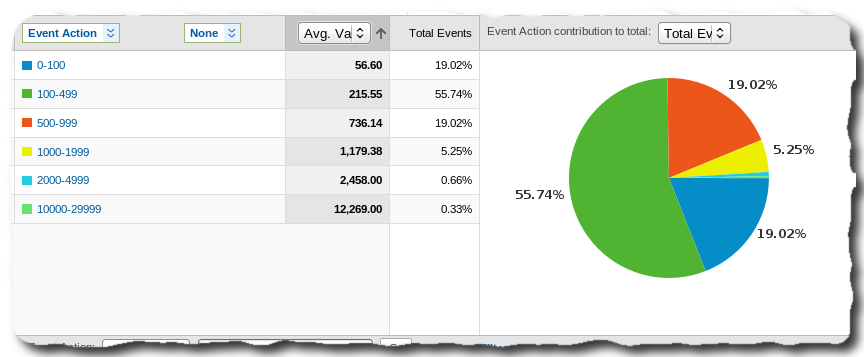
Distribution of ad load times:
Ad Position Starting Times
You can also see start offset times — the difference between the start of the page and ad loading.
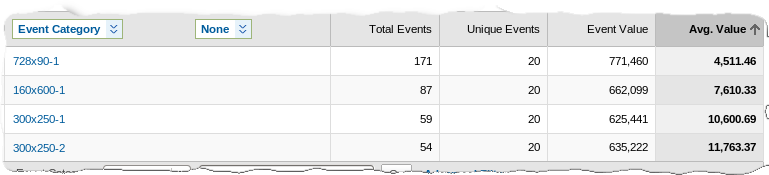
Average start time by position
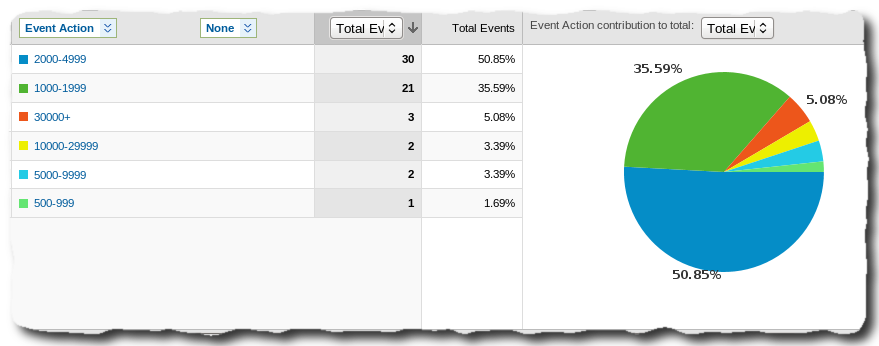
Start time distribution for 300×250-1 position
No Ghostwriter? No problem …
If you’re willing to put in some extra work, you can collect these metrics even if you’re not a GhostWriter customer. You’ll need to add a new <script> element below each of your ad calls and include this script. on your page. (This assumes you all ready have GA working to track pageviews)
<script>WARNING: It is NOT sufficient to simply add the tracker.end() calls after your ad loading code. It must be in a separate script block.
tracker= new ghostLoadReporter( "300x250-1" )
tracker.start()
// Normal ad loading code here ...
</script>
<script>
tracker.end()
</script>
This will let you start collecting the start offset and load time metrics for the ads on your page; however, you’ll be limited to just being able to collect this data. With GhostWriter, however, you will soon be able to get what I know you’re really after.
Analyzing The Entire Chain
Knowing start and end times for the ads on your page is great. The only problem is, you have no idea why some ads are slower. GhostWriter can fill that knowledge gap, giving you a breakdown of the URLs that contributed to an ad’s slowest. With this data, you can actually troubleshoot reports of your ads are making the site slow using empirical evidence.
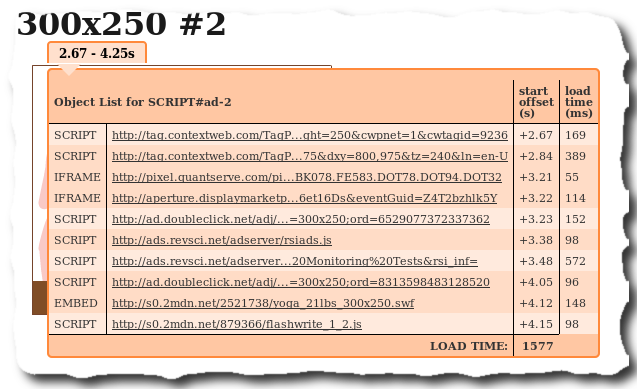
Our GhostWriter bubbles page shows a little bit of what we mean. After loading the ads, little “bubbles” appear above each one that tell you the start and end times for the entire ad. These two metrics are what we’re reporting into GA today. Expanding the bubbles, however, shows the entire daisy chain of delivery — It captures the load times for every SCRIPT, IMG, IFRAME and EMBED element along with the URL.
We’ll be reporting this level of detail shortly and let you identify which domains contribute most to latency. It’s a great way to keep an eye on your third-party content providers, many of whom have an SLA guaranteeing a certain quality of service.
We know you’re excited so we’ll get back to work!
If you’re interested in monitoring third-party content but not letting it impact the performance of your content, check out how GhostWriter puts you in complete control and check out our Free Trial.